
The test scores are in, and the results are not pretty: American schoolchildren suffered substantial academic setbacks as a result of the COVID-19 school lockdowns. The good news is there is a substantial amount of federal funding available to fight back against this learning loss, and states are now looking to employ data and analytics to maximize the impact of this money.
Earlier this month, the National Assessment of Educational Progress (NAEP), which is considered the gold standard for academic testing in the United States, released standardized test scores of 9-year-olds for the period between 2020 and 2022. The results show the first ever drop in math and the biggest drop in reading since 1990.
It was hard to find a silver lining in the NAEP results, which appeared to confirm the suspicions of millions of parents who weathered more than two years of school shutdowns, Zoom school, and hybrid learning environments.
“Across long-term trend reading and mathematics, there were no increases in scores for any of the selected student groups compared to 2020,” the National Center for Education Statistics (NCES) stated on its website.
That’s the aggregate picture. The data looks a little bit different when different populations are analyzed. For instance, high-achieving children had less learning loss than children who were scoring near the bottom of their classes to begin with, the NAEP results show. The NCES also found different rates of learning loss associated with city versus suburban schools, as well as different scores among ethnicities.
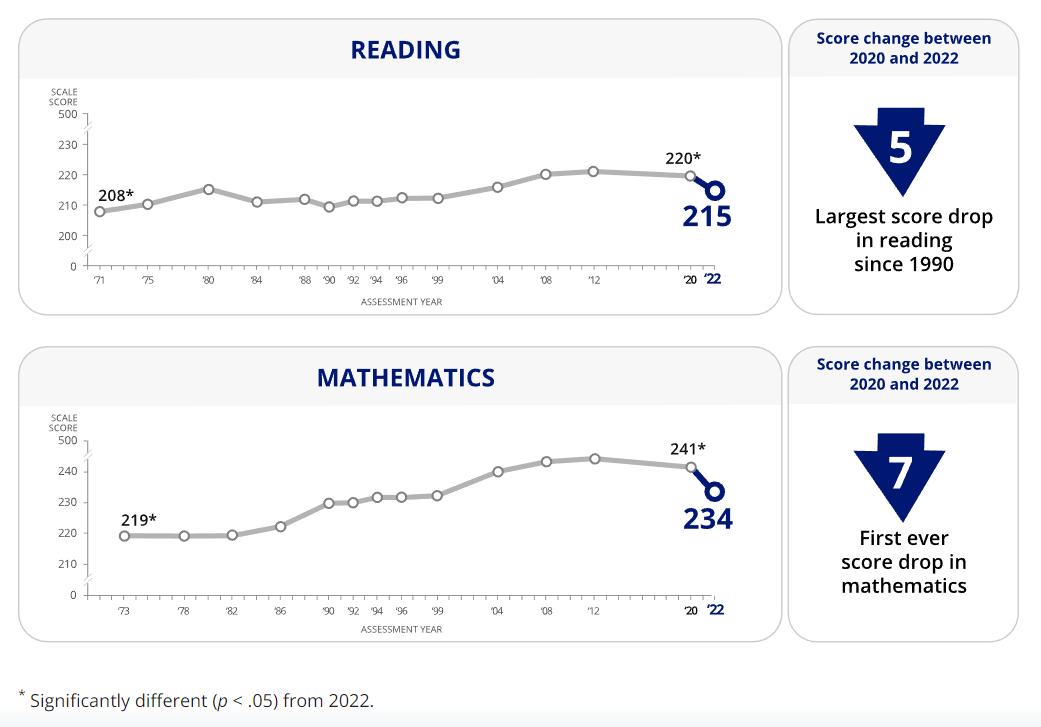
NAEP test results show 9-year-olds experienced learning loss between 2020 and 2022 (Source: NAEP)
As we begin the fourth academic year since the COVID-19 pandemic began, most public schools have opened back up for full-time in-person learning. Mask mandates are going away as the pandemic slowly recedes into history. The task for schools now is figuring out how to counteract the learning loss that has already happened, and to devise ways to prevent it from happening again. For the forward-looking schools of this country, that means digging into the data.
One of the people helping to use data and analytics to fight learning loss is Melody Schopp, who is the director of education industry consulting at analytics giant SAS. The former secretary of education for the State of South Dakota, Schopp leads the work SAS is doing with states to better understand the nuances of learning loss during the pandemic.
For the past 20 years, SAS has worked with 13 individual states and their departments of education to analyze student test scores as part of its Education Visualization and Analytics Solution (EVAAS) regimen. Because EVAAS provides a baseline for student achievement going back two decades, it provided a statistically valid way to predict what students’ academic achievement would have been if there had been no pandemic.
When the predicted scores were compared against the real-world scores following COVID-19, the EVAAS analysis showed a level of learning loss on track with the national NAEP test, but with some sizable caveats, Schopp says.
“The biggest takeaway that I think is really important is that, while there are generalizations and there are things we can say happened pretty much across the entire country, there are anomalies in every single state where we’ve done this analysis that are really key and critical as states are trying to figure out, what do we need to do next?” Schopp tells Datanami.
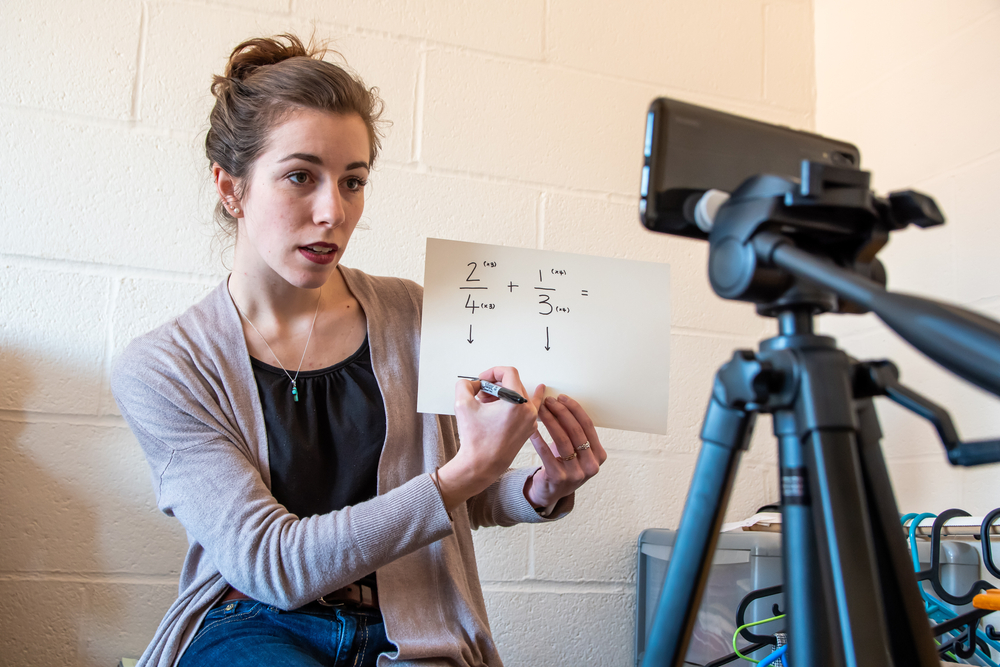
Remote learning was common during the COVID-19 pandemic (Timothy-Kuiper/Shutterstock)
When schools went into lockdown in March 2020, it forced all schools into 100% online mode. As the pandemic began to ease in late 2020 and 2021, some states moved to a hybrid setup, while others remained mostly locked down until just recently. Private schools also reopened, but this data is not collected in EVAAS or NAEP tests.
Interestingly, SAS’s analysis shows some students thrived during Zoom school while other students struggled, according to Schopp. Figuring out why that was the case could help to prevent it from happening again.
“Students who were lower income students may have been affected more, and that might have been based on not having access to any sort of devices or maybe it was Internet access itself,” says Schopp, who has a PhD. in education from the University of Nebraska.
Several of the states that SAS works with collected additional data that is pertinent to this analysis, including the modality of hybrid learning. North Dakota, for example, collected information on the modality and whether students were receiving face-to-face interaction.
“That was analysis that we never had reason to really do before, but they were able to add that information in there,” Schopp says. “That’s been really powerful data for states to look at as they’re making polices about the impact of remote learning, which I think everybody sees that it does have a place. We just need to know what the balance is, and be prepared not only with device access but also teacher training.”
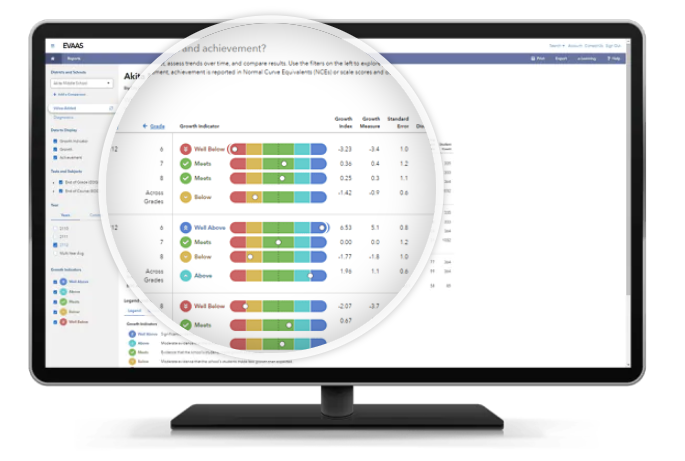
SAS tracks student achievement for 13 states with its EVAAS system (Image source: SAS)
The SAS analysis found that states that went back to in-person sooner tended to have less learning loss than those who were remote the entire time, Schopp says.
“Probably not surprising,” she adds. “But again, there were kids who were thriving in that environment. It just depended. There were many things that could have impacted it at the same time.”
SAS identified three school districts where the students out performed their peer districts in academic achievement during fully remote instruction. SAS is working with the states to analyze why that was the case, such as whether the teachers had previous training in remote instruction or whether there was a concerted effort to ensure that every student had a device and Internet access.
Schopp taught in the classroom for 24 years before moving into the administrative side of the profession. When she was working with the State of South Dakota around the turn of the century, remote learning was seen as the future of education, and a lot of investments were being made there.
“We were talking about how every kid was going to be able to learn remotely, have the best teacher in the entire state. And all of a sudden, this happens 20 year later, and everybody is kind of thrown for a loop,” she says. “It’s not like you can just turn a switch and all of a sudden you’re teaching everything you taught in the classroom online.”
When SAS analyzed data provided by the state of North Carolina, it found that the students who had previously been identified as academically gifted actually did worse in meeting their expected growth under EVAAS, Schopp says.
“However, the special education groups, and students who are English language learners, actually did better than what their expected growth was,” she says. “So there’s a lot of things you learn from that. Was it the additional touch points for them? Were there already structures in place for that?
“That’s the biggest takeaway,” she continues. “Providing this data down to the teacher level in the states we work with gives them really powerful, actionable data that they can then do something with going forward using the finding that they received.”
The federal government earmarked $190 billion in COVID-19 relief money to schools, which have until 2024 to spend it. In the latest accounting, only about $70 billion of that has been spent, leaving $120 billion for to be spent over the next 24 months. Schopp hopes that her group’s analysis can help states help individual school districts get the most benefit out of that large pool of money.
Schopp hopes that data and analysis provided by SAS and EVAAS can find its way down to the classroom. It won’t come in the form of detailed analytics presented on each child. That would be overkill for teachers. Instead, just having a heads up that little Bobby needs work on his reading and Susie needs work on her math could be all that’s needed to help the teacher make the most of her time in the classroom.
“Classrooms teacher are not made to be data scientists. They know their practice. They know what to do,” Schopp says. “There’s 24 little squishy kids walk in at the beginning of the school year. They all have different needs. But if a state invests in providing that teacher really solid data to be able to say, these two kids are coming in six months behind where they should be, the teacher can then more or less take that information and do what they need to do, what they know best, in changing how they teach that group of kids based on the rest of the kids.”
Related Items:
Getting Creative with COVID-19 Contact Tracing
Shrinking the Education Gap in Data Science
A Race Against Time to Model COVID-19
This article originally appeared in Datanami.