

Every two years the National Science Board is required by Congress to issue a report on the state of science and engineering in the U.S. This year, in a departure from past practice, the NSB has divided the 2020 S&E Indicators Report into three subset reports – the S&E Labor Force; STEM Education K-12; and STEM Higher Education – all issued at different times last month. Perhaps not surprisingly many of the trends seen in the 2020 S&E Indicators reports reflect a continuation of findings from two years ago.
 (FYI: Broadly, the NSB is the National Science Foundation’s governing board guiding strategy internally and advising Congress and the Administration. NSB’s 24 members are appointed by the President for six-year terms.)
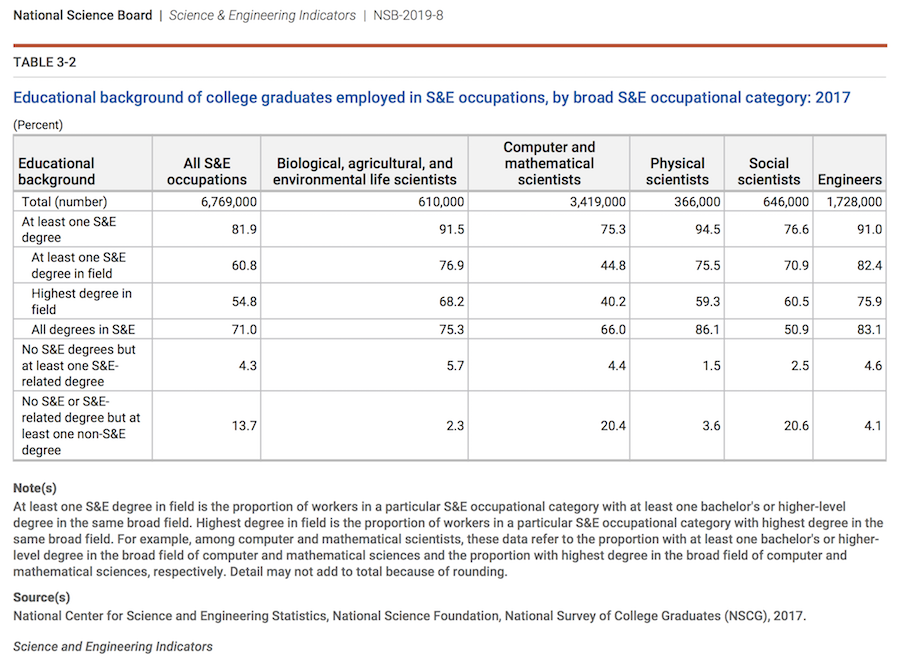
Comparison between current and past reports is somewhat cumbersome as a result of changes to their format but there’s still plenty to chew on. As always, the Indicators reports don’t drill deeply into individual in S&E disciplines but the top line numbers are still interesting. For example, there are about 3.4 million computer and mathematics professionals (bachelor degree or higher) versus 366,000 physical scientists (bachelor degree or higher) according to the Workforce report (2017 data). The bachelor’s degree is the most prevalent S&E degree, accounting for nearly 70% of S&E postsecondary degrees awarded, according to the report.
The workforce report offers the following description: “S&E degree fields include computer and mathematical sciences, life sciences, physical sciences, social sciences, and engineering. S&E occupations fall into these same five broad occupational categories and include postsecondary teachers of these same broad fields of study. S&E-related degree fields of study include those in health sciences and health technology and technical fields. S&E-related occupations include those workers in health, precollege science teachers, S&E managers, and S&E technicians and technologists (for a detailed list of the fields of degrees and occupations included in these definitions, see NCSES SESTAT 2013: Table A-1 and A-2).”
There are few year-to-year growth numbers presented in the latest report and, interestingly, the Bureau of Labor Statistics says “employment of computer programmers is projected to decline 7 percent from 2018 to 2028” on the BLS web site. Conversely jobs for computer and information research scientists will grow 5 percent over the same period according to BLS. How one slices the pie matters.
Here’s the NSB portrait of the S&E workforce as illustrated by the “key takeaways” excerpted from the 2020 S&E labor force report:
- “The estimated size of the science and engineering (S&E) workforce ranges from nearly 7 million in S&E occupations to nearly 25 million with an S&E degree (at the bachelor’s level or higher). The S&E workforce can be defined in a variety of ways: as workers in S&E occupations, as holders of S&E degrees, or as those who use S&E technical expertise on the job.
- “The business sector employs most S&E workers with a bachelor’s degree or higher (71%), followed by the education (18%) and government (11%) sectors; for S&E doctorate holders, both the business (48%) and education (43%) sectors are prominent employers.
- “The number of women in S&E occupations or with S&E bachelor’s level degrees doubled over the past two decades. In 2017, they were underrepresented in S&E occupations (29%) and S&E degrees (40%) relative to their proportion of the U.S. residential population age 21 or older (52%).
- “The number of blacks, Hispanics, and American Indians or Alaska Natives with their highest degree in S&E collectively increased nearly four-fold since 1993. They are underrepresented in S&E occupations (13%) and degrees (16%) relative to their proportion of the U.S. residential population age 21 or older (28%).
- “There are over 17 million workers in the skilled technical workforce (STW)—those with some high school or a high school diploma, some college or an associate’s degree, or equivalent training in occupations that employ significant levels of S&E expertise and technical knowledge.
- “Individuals in the S&E workforce, including skilled technical workers, tend to have higher incomes and lower unemployment rates than their counterparts in the general workforce.”
Past S&E Indicators reports have tended to offer more commentary. For example in the 2018 S&E report covered international investment, among other things (see HPCwire coverage, US Leads but China Gains in NSF 2018 S&E Indicators Report). The 2020 reports stick pretty much to the statistics. Whether by design or chance, the change seems noticeable. It’s also worth remembering these reports are unavoidably snapshots of the recent past. The 2020 reports are largely based on 2017 data; the 2018 report was based on 2015 data.
Notably, a more future-looking NSB report – The Skilled Technical Workforce – was released at roughly the same time as the 2020 indicators; it focuses on individuals who use S&E skills in their jobs but do not have a bachelor’s degree. That report says, “Rapid changes in the nature of work, education, technology, workforce demographics, and international competition have led the National Science Board (NSB, Board) to conclude that our competitiveness, security, and research enterprise require this critical, but often overlooked segment of our STEM-capable workforce. Adding to the near-term urgency, a National Academies of Sciences, Engineering, and Medicine report predicts a shortfall of nearly 3.4 million skilled technical workers by 2022.”
Indeed, the shortage well-qualified IT staff is a long simmering topic in HPC and as mentioned there is less narrative on this and other controversial issues generally in the 2020 reports. Shown below is a figures comparing salaries. NSB reports the data sources used in the most recent study are the same as those used in the past.

Education and training, particularly in HPC, have long been spotlighted as pressing needs and frequently generate disdcussion over the large number of foreign students pursuing S&E in the U.S.. The NSB 2020 report on higher education notes the U.S. remains a top destination for foreign students despite a recent decline in their numbers. Here’s an excerpt from that report:
“The U.S. higher education system remains a top destination for foreign S&E students. Although 2018 marked a second year of decline in the total number of foreign students studying in the United States, the decline was small (less than 1%), and more undergraduate and graduate students were studying S&E fields. Four countries—China, India, South Korea, and Saudi Arabia—account for more than half of foreign students in the United States. The number of Chinese S&E graduate students studying in the United States has continued to increase (by 11% over the last 2 years), whereas the number of Indian S&E graduate students sharply declined (by 22% over the last 2 years).
“Foreign students account for about one-third of U.S. S&E doctorate recipients, a relatively stable proportion over time. They account for half or more of the doctorate recipients in engineering, computer sciences, and economics. China, India, and South Korea are the top three source countries for foreign recipients of U.S. S&E doctoral degrees.In comparison, students on temporary visas earn a smaller share (around 5%) of S&E bachelor’s degrees; however, the number of these students has more than doubled over the last 10 years.
“Other nations’ higher education systems have become increasingly competitive. S&E first university degrees awarded by Chinese institutions doubled to 1.7 million between 2005 and 2015, far outpacing most other countries, including the United States. Institutions in the United States award more S&E doctoral degrees than any other nation. However, in natural sciences and engineering, China surpassed the United States in 2007 as the world’s largest producer of doctoral degrees and has remained so since.”
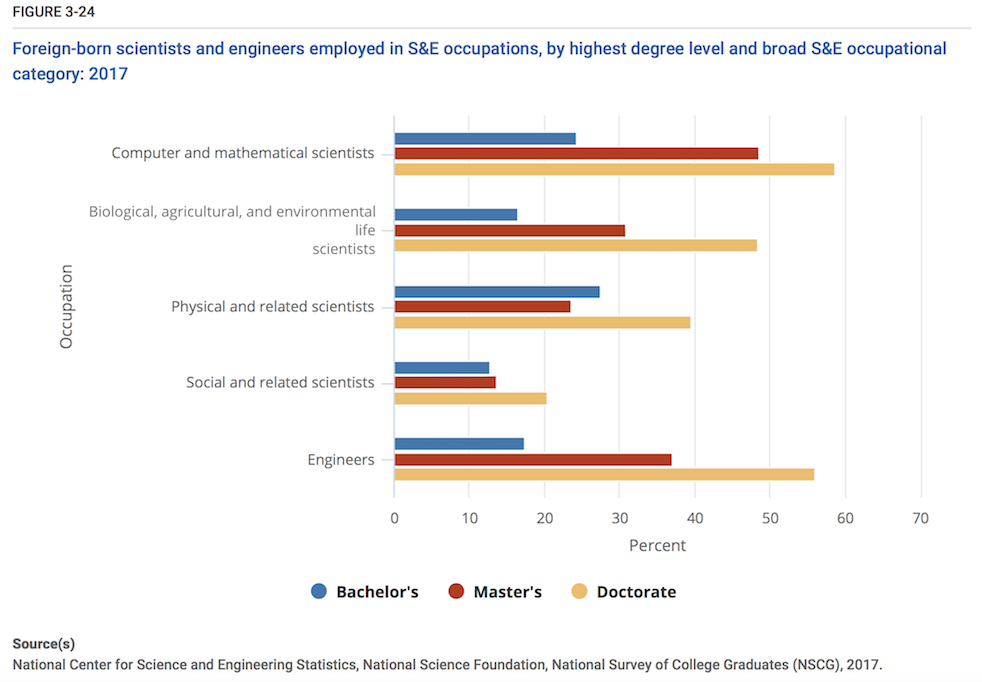
While debate continues over whether educating foreign students represents a brain drain, the NSB workforce report noted, “Foreign-born individuals account for a considerable share of S&E employment in the United States (nearly 30%). Foreign-born noncitizens comprise a large proportion of S&E doctorate holders; for the most part, these doctorate recipients intend to stay in the United States to pursue their careers upon graduation—with many securing firm offers of work within a year of graduation. Furthermore, the bulk of these students remain working in the United States 5 to 10 years later, indicating that their contributions to the U.S. economy continue well after their training in U.S. institutions ends.”
Among U.S.-born students the higher education report notes many groups of Americans remain underrepresented among S&E degree recipients. “Women are at or approaching parity with men at most degree levels overall, but within fields, long-standing differences persist, especially in engineering, computer sciences, and mathematics and statistics. Blacks are underrepresented at all degree levels; Hispanics and American Indians and Alaska Natives are underrepresented at all but the associate’s level. Members of different racial and ethnic groups are more likely to earn S&E degrees, especially doctorates, from for-profit institutions, which may have consequences for debt levels and career outcomes.”
As in the past the NSB reports on the state of S&E remain a rich source of information. Although the lavish dashboard that made exploring the NSB 2018 S&E Indicators report so easy is missing, the current threesome of reports is still worth perusing for areas of interest. The data sources are essentially the same making comparison’s valid, says NSB.
Links to three NSB 2020 S&E Reports
Labor Force: https://ncses.nsf.gov/pubs/nsb20198/executive-summary
STEM Education K-12: https://ncses.nsf.gov/pubs/nsb20196/
STEM Higher Education: https://ncses.nsf.gov/pubs/nsb20197/